
Date: 2026-11-13 Author: Emerson Acero
How Motorcoach Operators Can Fight Rising Diesel Costs in 2026 With Smart Fleet Technology
Diesel is averaging $6.29 a gallon across the U.S. For motorcoach operators, the cost that matters most is the one they can control: every minute the engine runs and the wheels don’t.
The coach is parked outside the hotel.
Passengers are still checking out.
The engine is running. The heat stays on.
Ten minutes pass. Then twenty. Then forty.
Nothing breaks. Nobody complains.
But someone is paying for those forty minutes.
And this year, that someone is you.
What $6 Diesel Means for Your Operation

A year ago, diesel averaged $3.75 a gallon. As of November 3, 2026, the U.S. national average was $6.29. (Source: U.S. Energy Information Administration)
Prices vary by region. Even on the Gulf Coast, which includes Texas and is the cheapest region in the country, diesel averaged $5.91. In California, it was $8.08. (Source: U.S. Energy Information Administration)
The causes are global: U.S. distillate inventories, which include diesel, are 13% below their five-year average, and worldwide supply remains tight. (Source: U.S. Energy Information Administration) We’ll leave the politics to others.
What matters for your business is simpler:
Every gallon your fleet burns now costs nearly 70% more than it did a year ago.
And the U.S. Energy Information Administration expects prices to come down only gradually, with inventories staying below normal into 2027.
You can’t control the price.
But you can control how many gallons you pay for that never move a single passenger.
The Fuel You’re Paying For but Not Using

Every motorcoach burns fuel while it waits.
At hotel pickups. Outside venues. During driver breaks. Warming up in a cold yard.
A bus burns roughly one gallon of diesel for every hour it idles. (Source: U.S. Environmental Protection Agency)
One hour a day doesn’t sound like much. Here’s what it adds up to over 250 working days:
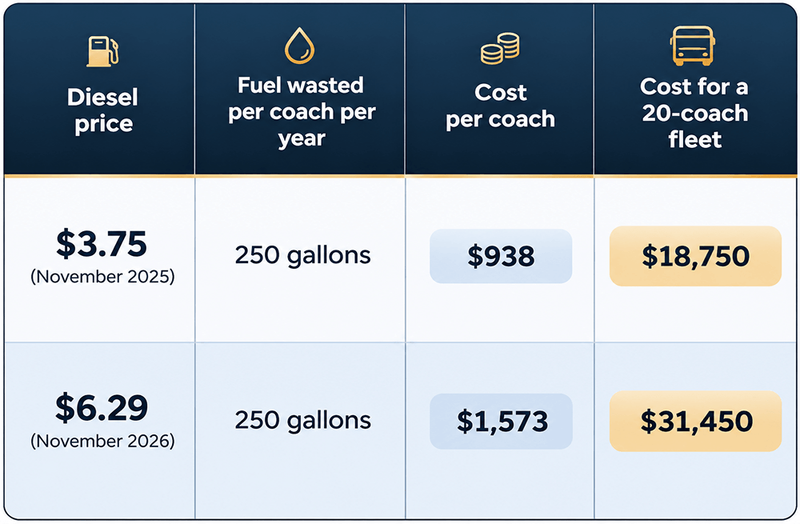
Same drivers. Same routes. Same habits.
About $12,700 more for a 20-coach fleet this year.
And peak season is about to multiply it. The weeks from Thanksgiving through New Year’s are the busiest travel period of the year.
More charters. More pickups. More time standing still.
Five Questions Every Operator Should Be Able to Answer
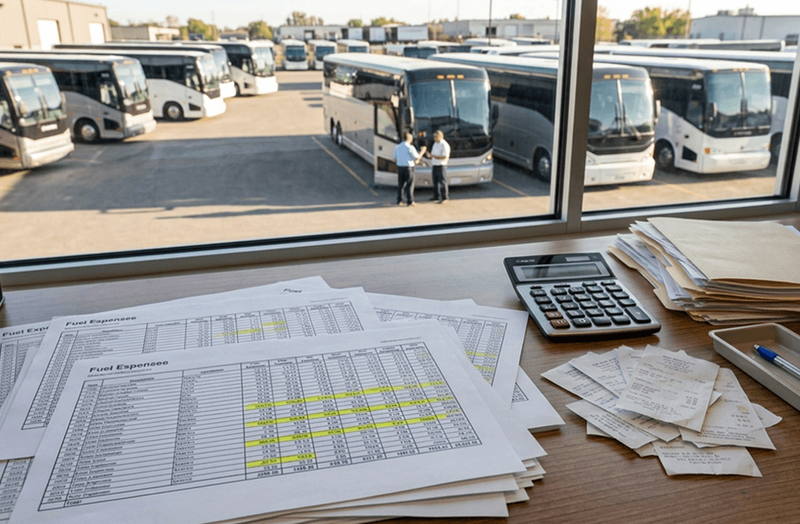
Here’s a quick test.
Can you answer these about your fleet today, without waiting for month-end?
- Which coaches idled the most last week?
- How many idle hours did your fleet log yesterday?
- Which routes burn more fuel than they should?
- Which driver habits are costing you the most?
- How much did idle time cost you last month, in dollars?
If you can answer all five, you’re ahead of most of the industry.
If you can’t, you’re not alone.
Fuel cards, monthly reports, and spreadsheets were built to tell you what you spent. Not where it went. And not while there’s still time to act.
That worked when diesel was $3.50.
At $6, the gap between “what happened” and “what’s happening right now” is where your margin disappears.
That’s why fleets across transportation are moving to AI and real-time vehicle data. For motorcoach operators, it’s quickly becoming the difference between absorbing rising costs and controlling them.
How EYERIDE Gives You Those Answers

EYERIDE.IO was built for operators who can’t control the price of diesel, but can control how much of it they waste.
The questions above shouldn’t take a month to answer. With EYERIDE, they’re on your screen every day:
- Which coaches are idling, and for how long? Real-time idle alerts flag any coach that sits with the engine running and no movement for more than 10 minutes. Dispatch sees it while it’s happening, not at the end of the month.
- Where is your fuel going? A fuel KPI for every vehicle shows how much each coach consumes, so you can compare vehicles side by side and spot the outliers.
- Which routes burn too much? AI-driven route optimization cuts unnecessary miles, congestion, and stop-and-go driving.
- What’s behind the numbers? Driver behavior insights, live GPS tracking, and engine diagnostics in the same view show the habits that drive fuel costs.
Back at the hotel, the story changes.
Minute ten: an idle alert reaches dispatch.
Minute eleven: dispatch checks in with the driver.
Minute twelve: the engine is off.
Forty minutes of idling becomes ten.
Now multiply that across every coach, every pickup, and every day of peak season.
Not to police drivers.
But to give your team the information they need to act in time.
Final Thought

No operator can decide what diesel costs.
But every operator can decide how much of it goes to waste.
The fleets that come out of this season strongest won’t be the ones waiting for prices to drop.
They’ll be the ones who can see exactly where every gallon goes.
Want to know what idle time is costing your fleet? Request a demo, and we’ll show you what EYERIDE would reveal in your own operation.
Every mile counts.
And so does every minute standing still.
Sources
- U.S. Energy Information Administration (EIA), Weekly Retail On-Highway Diesel Prices, released November 3, 2025 and November 3, 2026.
- U.S. Energy Information Administration (EIA), Weekly Petroleum Status Report, week ending October 30, 2026.
- U.S. Energy Information Administration (EIA), Short-Term Energy Outlook, October 2026.
- U.S. Environmental Protection Agency (EPA), idling fuel consumption estimate, as published by the Maryland Department of the Environment.
